Blog Journal 10
Project 5 involved using different tools to create an interactive PowerPoint that could be used to teach a subject. One major thing I learned was creating navigation buttons within the presentation by assigning navigation instructions to an object so it can move slides without using the keys. I was surprised that I could even do that in a PowerPoint because I have only seen objects with assigned actions in coding, where users construct a line of code to make sure the object completes a desired action. I learned a new editing feature that turns an image more transparent to make it stand out less from another image.
 |
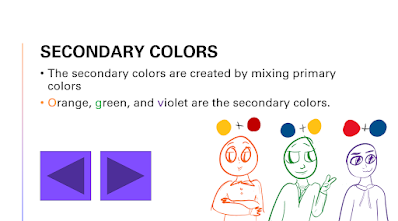
| The purple navigation buttons shown can go to the previous slide or the next slide. |
 |
| Of these two, you can see that the right image is the correct answer to the question. |
My favorite part of the project was using the drawing tool to bring the colors of the color wheel to life using the "Draw" feature on PowerPoint (see below). I think including my own drawings in a class presentation added to my credibility of being an art teacher (in a hypothetical sense). My drawings also stand out from just regular graphics because they are my own and thus I don't have to worry about copyright.
I think I could further improve on the project by making the transitions and animations more consistent. There were a few slides that I forgot to include transitions and I think that if I went back and added transitions to all the slides instead of just a few, it would make the presentation more symmetrical.
Data collection tools would be pretty helpful for me as an educator because they can facilitate class lessons on data collection analysis. In the elementary levels, students start out in Kindergarten through second grade by collecting simple data and putting it in graphs. After third grade, they move on to calculating numbers for that data based on graphs and surveys and interpreting it. For a third-grade class, as a basic data-collecting exercise, I could create a survey about students' favorite colors out of the colors of the rainbow (red, orange, yellow, green, blue, and violet). With the data collected, I can have students create a bar graph about the favorite colors of everyone in the class. Students can also calculate the frequency of the responses (11 students out of 27 students voted red as their favorite color, which is 11/27 or 41% of the class). It would be easier to gather this data by having the students take a survey rather than me just asking them which color they prefer. Information collected verbally is also prone to errors; in this situation, there's a chance I could either forget or mix up a student's favorite color. On the other hand, surveys would be able to store the student's answers in a database where I can access them at any time.
One technological skill I hope I can develop more in the future is coding. In the past, I have not had success in learning a programming language mostly because I gave up too easily. However, I would like to learn to code once again because there are quite a few benefits to teaching text-based coding to students. It teaches students to aim for innovation in their school assignments and other endeavors, and it can also build problem-solving skills and help students apply logic to situations. I think I could learn coding by starting with learning a less complicated programming language like Python. Later, once I have enough confidence in text-based coding, I can move on to learning a more elaborate language like JavaScript.


Comments
Post a Comment